A lot of talk is going on about the VIX, also known as the CBOE Volatility Index. This index will track and correspond to the market’s expectation of 30 day volatility. What does that even mean?
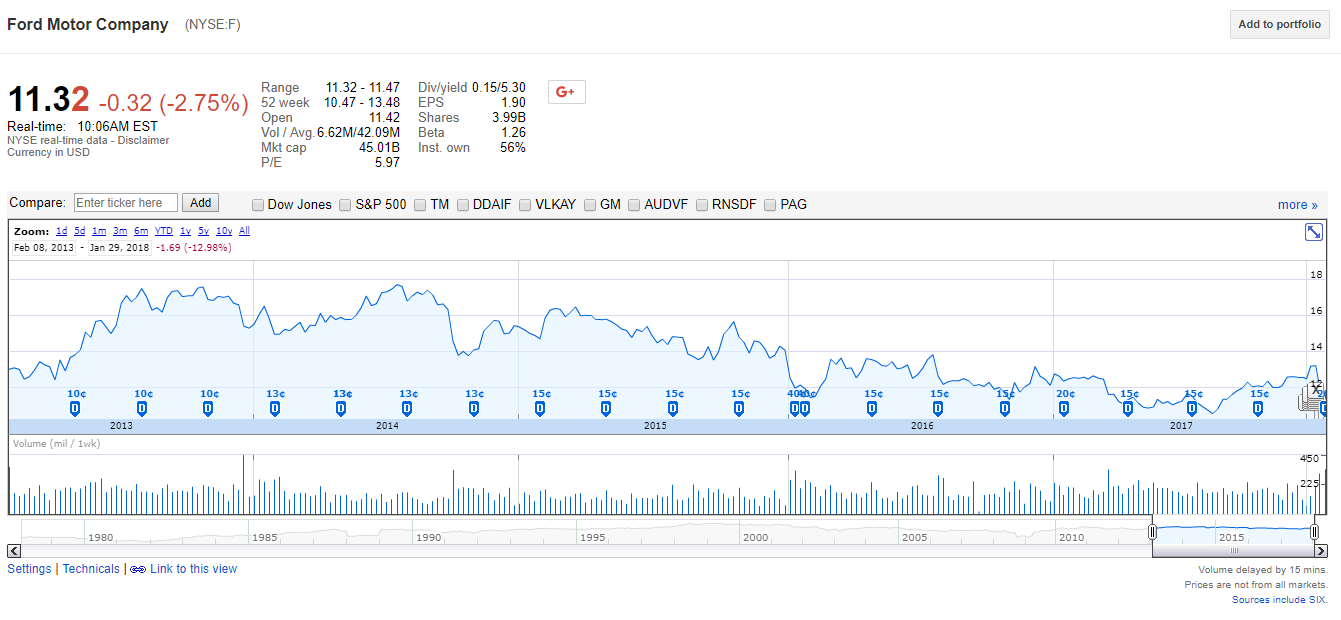
I can show you how to make your own volatility bet by using options for a single company. For example Ford.
Ford is one of those companies that I believe will either prove itself as relevant in the coming years or fade into obscurity.
So I can make a bet that Ford will be either go past 15 dollars or slide down past 8 dollars by January 18th, 2019. For a relatively low bet of just 32 dollars I can make a decent profit if the stock dips below

Option Spread

Ford Spread Profit Chart
| Stock Price |
Strike Price C |
Strike Price P |
Option Cost |
Gain |
Profit |
| 0 |
|
15 |
8 |
32.00 |
800 |
768.00 |
| 1 |
|
15 |
8 |
32.00 |
700 |
668.00 |
| 2 |
|
15 |
8 |
32.00 |
600 |
568.00 |
| 3 |
|
15 |
8 |
32.00 |
500 |
468.00 |
| 4 |
|
15 |
8 |
32.00 |
400 |
368.00 |
| 5 |
|
15 |
8 |
32.00 |
300 |
268.00 |
| 6 |
|
15 |
8 |
32.00 |
200 |
168.00 |
| 7 |
|
15 |
8 |
32.00 |
100 |
68.00 |
| 8 |
|
15 |
8 |
32.00 |
0 |
-32.00 |
| 9 |
|
15 |
8 |
32.00 |
0 |
-32.00 |
| 10 |
|
15 |
8 |
32.00 |
0 |
-32.00 |
| 11 |
|
15 |
8 |
32.00 |
0 |
-32.00 |
| 12 |
|
15 |
8 |
32.00 |
0 |
-32.00 |
| 13 |
|
15 |
8 |
32.00 |
0 |
-32.00 |
| 14 |
|
15 |
8 |
32.00 |
0 |
-32.00 |
| 15 |
|
15 |
8 |
32.00 |
0 |
-32.00 |
| 16 |
|
15 |
8 |
32.00 |
100 |
68.00 |
| 17 |
|
15 |
8 |
32.00 |
200 |
168.00 |
| 18 |
|
15 |
8 |
32.00 |
300 |
268.00 |
| 19 |
|
15 |
8 |
32.00 |
400 |
368.00 |
| 20 |
|
15 |
8 |
32.00 |
500 |
468.00 |
| 21 |
|
15 |
8 |
32.00 |
600 |
568.00 |
| 22 |
|
15 |
8 |
32.00 |
700 |
668.00 |
| 23 |
|
15 |
8 |
32.00 |
800 |
768.00 |
| 24 |
|
15 |
8 |
32.00 |
900 |
868.00 |
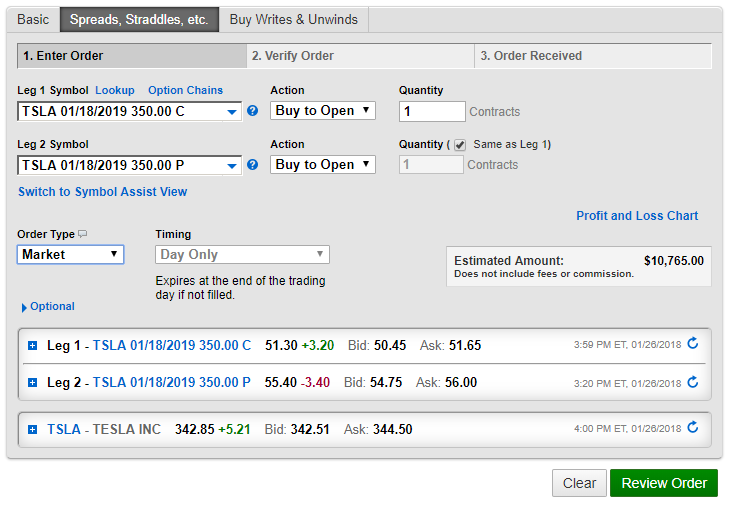
Another option strategy that makes people feel better about themselves since they will almost always get something back, but costs more, is called a “straddle”. A straddle, in this case with Tesla, is a bet that the stock price deviates from a certain point. In the figure below, a bet is being placed that the price of TESLA will deviate away from $350 per share by January 18, 2018. The price looks big, $10,765 for this particular strategy. But look below and you will see the profit loss chart shows that nears $200 or goes over $430 per share you will start making money again. This particular example I would not trade because the option prices are too high.
Option Straddle
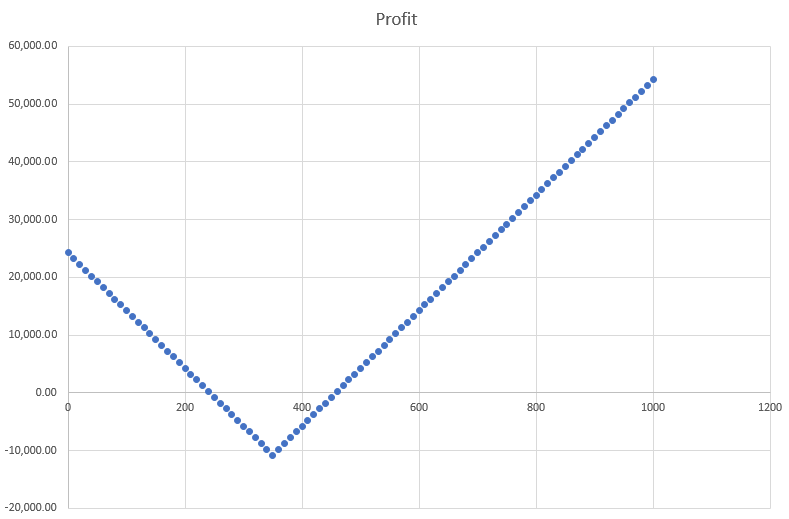
Tesla Straddle $350 Profit Chart
| Stock Price |
Strike Price |
Option Cost |
Gain |
Profit |
| 0 |
|
350 |
10,765.00 |
35000 |
24,235.00 |
| 10 |
|
|
10,765.00 |
34000 |
23,235.00 |
| 20 |
|
|
10,765.00 |
33000 |
22,235.00 |
| 30 |
|
|
10,765.00 |
32000 |
21,235.00 |
| 40 |
|
|
10,765.00 |
31000 |
20,235.00 |
| 50 |
|
|
10,765.00 |
30000 |
19,235.00 |
| 60 |
|
|
10,765.00 |
29000 |
18,235.00 |
| 70 |
|
|
10,765.00 |
28000 |
17,235.00 |
| 80 |
|
|
10,765.00 |
27000 |
16,235.00 |
| 90 |
|
|
10,765.00 |
26000 |
15,235.00 |
| 100 |
|
|
10,765.00 |
25000 |
14,235.00 |
| 110 |
|
|
10,765.00 |
24000 |
13,235.00 |
| 120 |
|
|
10,765.00 |
23000 |
12,235.00 |
| 130 |
|
|
10,765.00 |
22000 |
11,235.00 |
| 140 |
|
|
10,765.00 |
21000 |
10,235.00 |
| 150 |
|
|
10,765.00 |
20000 |
9,235.00 |
| 160 |
|
|
10,765.00 |
19000 |
8,235.00 |
| 170 |
|
|
10,765.00 |
18000 |
7,235.00 |
| 180 |
|
|
10,765.00 |
17000 |
6,235.00 |
| 190 |
|
|
10,765.00 |
16000 |
5,235.00 |
| 200 |
|
|
10,765.00 |
15000 |
4,235.00 |
| 210 |
|
|
10,765.00 |
14000 |
3,235.00 |
| 220 |
|
|
10,765.00 |
13000 |
2,235.00 |
| 230 |
|
|
10,765.00 |
12000 |
1,235.00 |
| 240 |
|
|
10,765.00 |
11000 |
235.00 |
| 250 |
|
|
10,765.00 |
10000 |
-765.00 |
| 260 |
|
|
10,765.00 |
9000 |
-1,765.00 |
| 270 |
|
|
10,765.00 |
8000 |
-2,765.00 |
| 280 |
|
|
10,765.00 |
7000 |
-3,765.00 |
| 290 |
|
|
10,765.00 |
6000 |
-4,765.00 |
| 300 |
|
|
10,765.00 |
5000 |
-5,765.00 |
| 310 |
|
|
10,765.00 |
4000 |
-6,765.00 |
| 320 |
|
|
10,765.00 |
3000 |
-7,765.00 |
| 330 |
|
|
10,765.00 |
2000 |
-8,765.00 |
| 340 |
|
|
10,765.00 |
1000 |
-9,765.00 |
| 350 |
|
|
10,765.00 |
0 |
-10,765.00 |
| 360 |
|
|
10,765.00 |
1000 |
-9,765.00 |
| 370 |
|
|
10,765.00 |
2000 |
-8,765.00 |
| 380 |
|
|
10,765.00 |
3000 |
-7,765.00 |
| 390 |
|
|
10,765.00 |
4000 |
-6,765.00 |
| 400 |
|
|
10,765.00 |
5000 |
-5,765.00 |
| 410 |
|
|
10,765.00 |
6000 |
-4,765.00 |
| 420 |
|
|
10,765.00 |
7000 |
-3,765.00 |
| 430 |
|
|
10,765.00 |
8000 |
-2,765.00 |
| 440 |
|
|
10,765.00 |
9000 |
-1,765.00 |
| 450 |
|
|
10,765.00 |
10000 |
-765.00 |
| 460 |
|
|
10,765.00 |
11000 |
235.00 |
| 470 |
|
|
10,765.00 |
12000 |
1,235.00 |
| 480 |
|
|
10,765.00 |
13000 |
2,235.00 |
| 490 |
|
|
10,765.00 |
14000 |
3,235.00 |
| 500 |
|
|
10,765.00 |
15000 |
4,235.00 |
| 510 |
|
|
10,765.00 |
16000 |
5,235.00 |
| 520 |
|
|
10,765.00 |
17000 |
6,235.00 |
| 530 |
|
|
10,765.00 |
18000 |
7,235.00 |
| 540 |
|
|
10,765.00 |
19000 |
8,235.00 |
| 550 |
|
|
10,765.00 |
20000 |
9,235.00 |
| 560 |
|
|
10,765.00 |
21000 |
10,235.00 |
| 570 |
|
|
10,765.00 |
22000 |
11,235.00 |
| 580 |
|
|
10,765.00 |
23000 |
12,235.00 |
| 590 |
|
|
10,765.00 |
24000 |
13,235.00 |
| 600 |
|
|
10,765.00 |
25000 |
14,235.00 |
| 610 |
|
|
10,765.00 |
26000 |
15,235.00 |
| 620 |
|
|
10,765.00 |
27000 |
16,235.00 |
| 630 |
|
|
10,765.00 |
28000 |
17,235.00 |
| 640 |
|
|
10,765.00 |
29000 |
18,235.00 |
| 650 |
|
|
10,765.00 |
30000 |
19,235.00 |
| 660 |
|
|
10,765.00 |
31000 |
20,235.00 |
| 670 |
|
|
10,765.00 |
32000 |
21,235.00 |
| 680 |
|
|
10,765.00 |
33000 |
22,235.00 |
| 690 |
|
|
10,765.00 |
34000 |
23,235.00 |
| 700 |
|
|
10,765.00 |
35000 |
24,235.00 |
Someone may have told you that in Blackjack insurance is a suckers bet, but if you ever looked into the counting strategy then in certain situations you should take the insurance. Currently I am only buying and writing call options at the time of this article and not utilizing spreads or straddles and have no intention of doing so in the next week or so. While the screenshots above are using market order types I strongly suggest to always trade using the limit order type on all option trades.